Category Archives: Browse Images

Mechanisms of Venous Return, with Animation

This video is available for licensing on our website. Click HERE!


Venous return is the flow of blood from the periphery back to the heart’s right atrium. Venous return is important because the more blood returns to the heart, the more blood can be pumped out. In other words, venous return is the major determinant of cardiac output.
Venous return is achieved by several mechanisms:
Pressure gradient: the difference between venous pressure and right atrial pressure is the major force driving peripheral blood back to the heart. In fact, venous return can be determined as the venous pressure gradient divided by venous resistance. Factors that increase venous pressure or decrease right atrial pressure, facilitate venous return. In principle, constriction of veins blocks blood flow, increases venous resistance and reduces venous return. However when blood vessels throughout the body are constricted, such as during sympathetic activation, the increased resistance causes blood pressure to rise, and this eventually overrides the increase in venous resistance. As a result, venous return increases.
Skeletal muscle pump: Veins in the arms and legs are surrounded by skeletal muscles. They also have one-way valves in their walls that only open for upward flow. During everyday activities, such as walking, the muscles contract and squeeze blood in the veins upward, toward the heart. The one-way valves prevent blood from flowing down again when the muscles relax. This is one of mechanisms by which physical exercise increases cardiac output to meet the body’s needs.
Gravity: In an upright position, venous blood from the head and neck flows downhill to the heart simply by gravity. Blood from the lower body and limbs, on the other hand, has to overcome gravity to return to the heart. People who stand or sit still for extended periods of time may suffer from venous blood pooling in the legs. This happens when venous pressure is not sufficient to override gravity and venous return is reduced. Because the heart cannot pump more blood than it receives, cardiac output may decrease, sometimes to a dangerous level, and the person may faint. One can prevent this from happening by activating the skeletal muscle pump, either by keeping the legs moving, or by tensing leg muscles periodically.
Breathing, or respiratory pump: during inspiration, the diaphragm moves down, expanding the thoracic cavity, resulting in a decreased intra-thoracic pressure and a subsequent expansion of the lungs. Part of this change in pressure is transmitted across the walls of the heart, lowering right atrial pressure and thus facilitating venous return. At the same time, the descent of the diaphragm also causes an increase in abdominal pressure. As the inferior vena cava passes through both abdominal and thoracic cavities, an increase in abdominal pressure together with a decrease in thoracic pressure squeeze the blood upward, toward the heart. Increasing the rate and depth of breathing is another way the body raises cardiac output during physical exercise.

Email this to someoneShare on FacebookTweet about this on TwitterShare on Google+Share on LinkedIn

Cervical Cancer, HPV and Pap Smear, with Animation

This video is available for licensing on our website. Click HERE!

Cervical cancer is cancer of the cervix, the lower part of the uterus that opens into the birth canal. It is one of the most common types of cancer in women worldwide, but also one of the most preventable, thanks to early detection with Pap tests.

The cervix has 2 major cell types: flat squamous cells lining the outer part, and column-shaped glandular cells covering the inside of the cervical canal. Both types can become cancerous but squamous cell carcinomas are MUCH more common. Cancer usually starts in the zone where the two cell types meet, known as the transformation zone.

Virtually all cervical cancers are caused by human papillomaviruses, or HPVs. There are over a hundred different types of HPV, some of which pose HIGHER risks than others.  About 70% of all cases are caused by just TWO types: HPV-16 and HPV-18. Two proteins produced by HPV, known as E6 and E7, INTERFERE with cell functions that normally PREVENT EXCESSIVE cell division. This causes the cells to grow in an UNcontrolled manner.

HPV is sexually transmitted and is VERY common, but in most women, HPV infections resolve on their own and do NOT cause cancers. Factors that may INcrease the risk of PERSISTENT HPV infections include WEAKENED immune system, other sexually transmitted diseases and smoking. Chances of developing cervical cancer also increase with having many children and LONG-term use of birth control pills.

Early-stage cervical cancer generally produces NO symptoms. Advanced-stage disease may cause ABnormal or IRregular vaginal bleeding, pelvic pain, or unusual vaginal discharge.

EARLY detection is the key to prevent cervical cancer. Cervical cancer screening may include pap tests ALONE, or in combination with HPV DNA tests.  In a pap test, cells are scraped from the cervix and examined for PRE-cancerous changes, known as cervical intraepithelial neoplasia, or cervical DYSPLASIA. These morphological changes can range from mild to severe. If the results are ABnormal, the test is repeated again after 6 months or a year to MONITOR the condition. Additional diagnostic tests may also be performed. In most cases, MILD dysplasia resolves on its own and a follow-up pap test is all that is required to confirm. In a small number of cases, these ABnormal cells may develop into cancer, but they usually take YEARS to do so, which allows plenty of time for treatment when detected early. In the US, a pap test is recommended every 3 years, from the age of 21, or every 5 years if combined with an HPV test.

Treatment options for cervical cancer include surgery, radiation, chemotherapy or a combination of these. Early-stage cervical cancer is typically treated with surgical removal of the uterus. This option is the most effective in preventing cancer from coming back and is usually preferred when patients do NOT need to maintain fertility.
Email this to someoneShare on FacebookTweet about this on TwitterShare on Google+Share on LinkedIn

Cholesterol Metabolism, with Animation

This video is available for licensing on our website. Click HERE!
Despite having a BAD reputation as a high-risk factor for cardiovascular diseases, cholesterol is an ESSENTIAL component of all animal cells. It is an INTEGRAL part of the cell membrane, providing membrane FLUIDITY and participating in a number of cellular processes. Cholesterol also serves as a PRECURSOR for production of bile, steroid hormones, and vitamin D. While the body can obtain cholesterol from food, many cells SYNTHESIZE their own ENDOGENOUS cholesterol. Cellular production of cholesterol is under NEGATIVE FEEDBACK control. LOW levels of intracellular cholesterol INDUCE its own production, while HIGH cholesterol levels INHIBIT it.
Cholesterol, together with other lipids, is transported in blood plasma within large particles known as LIPOPROTEINS. A lipoprotein is an assembly of lipids and proteins. Lipoproteins are classified based on their DENSITY. Because lipids are LIGHTER than proteins, particles that contain MORE lipids are LARGER in size but have LOWER density. Different types of lipoproteins have different sets of proteins on their surface. These proteins serve as “ADDRESS tags”, determining the DESTINATION, and hence FUNCTION, of each lipoprotein. For example, LOW-density lipoprotein, LDL, carries cholesterol FROM the liver to other tissues, while HIGH-density lipoprotein, HDL, RETURNS excess cholesterol TO the liver.
Major events in cholesterol metabolism include:
– Dietary cholesterol ABSORBED in the intestine and carried via blood circulation to the liver.
– The liver PACKAGES its cholesterol pool – a combination of endogenous and dietary – together with triglycerides, another type of lipid, into particles of VERY-LOW-density lipoprotein, VLDL.
– VLDL travels in bloodstream to other organs. During circulation, muscle and adipose tissues EXTRACT triglycerides from VLDL, turning it into LOW-density lipoprotein, LDL.
– Peripheral cells TAKE UP LDL by endocytosis, using LDL receptor. Cholesterol is used in cell membrane and other functions.
– EXCESS cholesterol is exported from the cells and delivered to HIGH-density lipoprotein, HDL, to be RETURNED to the liver in a process called REVERSE cholesterol transport.
– The liver uses cholesterol to produce BILE; bile is secreted to the intestine, where it helps break down fats. Part of this bile is EXCRETED in feces; the rest is RECYCLED back to the liver.
LDL has the highest cholesterol content and is the MAJOR carrier of cholesterol in the blood. High levels of LDL in the blood are associated with cholesterol plaque build-up and cardiovascular diseases such as heart attacks and strokes. For this reason, LDL is known as “BAD” cholesterol. On the other hand, HDL is called “GOOD” cholesterol, because it REMOVES EXCESS cholesterol from tissues and bloodstream.
Common drugs used to LOWER cholesterol include: INHIBITORS of endogenous cholesterol PRODUCTION; INHIBITORS of intestinal cholesterol ABSORPTION; and INHIBITORS of bile reuptake.

Email this to someoneShare on FacebookTweet about this on TwitterShare on Google+Share on LinkedIn

Diabetic ketoacidosis, DKA, with Animation

This video is available for licensing on our website. Click HERE!

Diabetic ketoacidosis, DKA, is an ACUTE and potentially life-threatening complication of diabetes mellitus. DKA is commonly associated with type 1 but type 2 diabetics are also susceptible. DKA is caused by a critically LOW INSULIN level and is usually triggered when diabetic patients undergo further STRESS, such as infections, INadequate insulin administration, or cardiovascular diseases. It may also occur as the FIRST presentation of diabetes in people who did NOT know they had diabetes and therefore did NOT have insulin treatment.
Glucose is the MAJOR energy source of the body. It comes from digestion of carbohydrates and is carried by the bloodstream to various organs. Insulin is a hormone produced by beta-cells of the pancreas and is responsible for DRIVING glucose INTO cells. When insulin is DEFICIENT, glucose can NOT enter the cells; it stays in the blood, causing HIGH blood sugar levels while the cells are STARVED. In response to this metabolic starvation, the body increases the levels of COUNTER-regulatory hormones. These hormones have 2 major effects that are responsible for clinical presentation of DKA:
– First, they produce MORE glucose in an attempt to supply energy to the cells. This is done by breaking down glycogen into glucose, and synthesizing glucose from NON-carbohydrate substrates such as proteins and lipids. However, as the cells CANNOT use glucose, this response ONLY results in MORE sugar in the blood. As blood sugar level EXCEEDS the ability of the kidneys to REabsorb, it overflows into urine, taking water and electrolytes along with it in a process known as OSMOTIC DIURESIS. This results in large volumes of urine, dehydration and excessive thirst.
– Second, they activate lipolysis and fatty acid metabolism for ALTERNATIVE fuel. In the liver, metabolism of fatty acids as an alternative energy source produces KETONE bodies. One of these is acetone, a volatile substance that gives DKA patient’s breath a characteristic SWEET smell. Ketone bodies, unlike fatty acids, can cross the blood-brain barrier and therefore can serve as fuel for the brain during glucose starvation. They are, however, ACIDIC, and when produced in LARGE amounts, overwhelm the buffering capacity of blood plasma, resulting in metabolic ACIDOSIS. As the body tries to reduce blood acidity by EXHALING MORE carbon dioxide, a deep and labored breathing, known as Kussmaul breathing may result. Another compensation mechanism for high acidity MOVES hydrogen ions INTO cells in exchange for potassium. This leads to increased potassium levels in the blood; but as potassium is constantly excreted in urine during osmotic diuresis, the overall potassium level in the body is eventually depleted. A blood test MAY indicate too much potassium, or hyperkalemia, but once INSULIN treatment starts, potassium moves BACK into cells and hypokalemia may result instead. For this reason, blood potassium level is monitored throughout treatment and potassium replacement is usually required together with intravenous fluid and insulin as primary treatment for DKA.

Email this to someoneShare on FacebookTweet about this on TwitterShare on Google+Share on LinkedIn

Male Reproductive System Gallery

Download diagrams of male organs anatomy and diseases, formation and structure of sperms.

Please note: Free downloads are intended to facilitate healthcare education for people in need in low income countries and can be used for educational purposes only. If you can afford it or if you plan to use the images for commercial purposes, please consider buying instead. You can find a larger image collection at higher resolution for sale at affordable prices on Alila Medical Media website.

To download: right click on full size image – choose “Save image as” and save it into your computer. By downloading from this website you acknowledge that you agree to our Conditions of Use.
To purchase larger sizes of the image: (left) click on full size image.

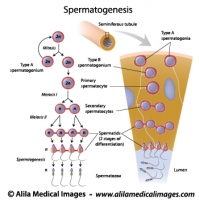
Spermatogenesis process, labeled diagram.
Process of sperm production and meiosis in seminiferous tubule, labeled diagram.
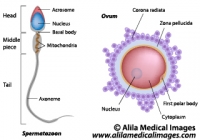
Ovum and spermatozoon structure, labeled diagram.
Egg and sperm cells anatomy, labeled drawing.
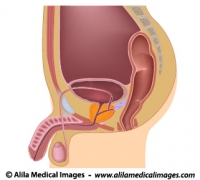
Male reproductive organs sagittal, unlabeled diagram.
Illustration of male reproductive system in median section
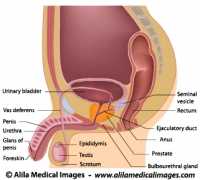
Male reproductive organs sagittal, labeled diagram.
Illustration of male reproductive system in median section
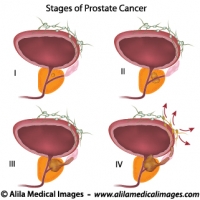
Prostate cancer staging, unlabeled diagram.
Illustration of staging of prostate gland cancer, from small tumor size to metastasis.
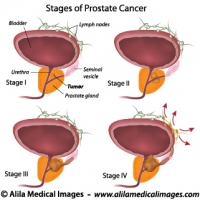
Prostate cancer staging, labeled diagram.
Illustration of staging of prostate gland cancer, from small tumor size to metastasis.


Email this to someoneShare on FacebookTweet about this on TwitterShare on Google+Share on LinkedIn

Lymphatic System Gallery

Download illustrations of major groups of lymph nodes, lymphatic organs and vessels, their anatomy, function, disorders and involvement in cancer metastasis.

Please note: Free downloads are intended to facilitate healthcare education for people in need in low income countries and can be used for educational purposes only. If you can afford it or if you plan to use the images for commercial purposes, please consider buying instead. You can find a larger image collection at higher resolution for sale at affordable prices on Alila Medical Media website.

To download: right click on full size image – choose “Save image as” and save it into your computer. By downloading from this website you acknowledge that you agree to our Conditions of Use.
To purchase larger sizes of the image: (left) click on full size image.

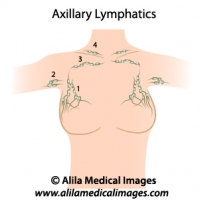
Axillary lymph nodes, medical drawing.
Axillary lymph nodes diagram, simple version. 1-3 = different groups of axillary nodes, 4= supraclavicular lymph nodes. Unlabeled diagram.
Lymph node structure, unlabeled diagram.
Diagram illustrating structure of a lymph node with lymph flow, unlabeled.
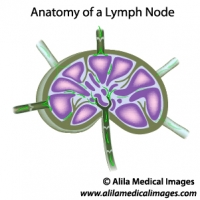
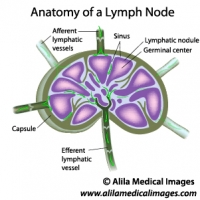
Lymph node structure, labeled diagram.
Diagram illustrating structure of a lymph node with lymph flow, labeled.
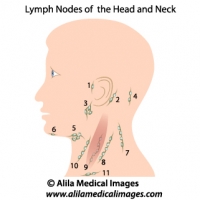
Lymph nodes of head and neck, medical drawing.
Lymph nodes of the head and neck, unlabeled. 1= preauricular, 2= posterior auricular, 3= parotid, 4= occipital, 5= submandibular, 6= submental, 7-10 = cervical, 11= supraclavicular.
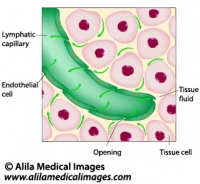
Lymphatic fluid drainage, labeled diagram.
Uptake of tissue fluid by lymphatic capillary, labeled drawing.
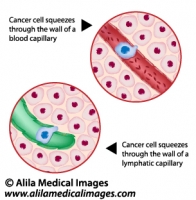
Metastatic cancer, medical drawing.
Cancer cell squeezes through the endothelium of blood and lymph vessel, illustration unlabeled.
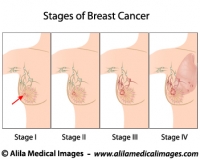
Breast cancer staging, diagram.
Stages of Breast Cancer, from small tumor to metastasis, medical illustration, unlabeled.
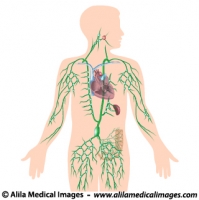
Lymphatic system, unlabeled diagram.
Human lymphatic system with all organs, major trunks, ducts and groups of lymph nodes illustrated, unlabeled illustration.
Lymphatic system, labeled diagram.
Human lymphatic system with all organs, major trunks, ducts and groups of lymph nodes illustrated, labeled illustration.


Email this to someoneShare on FacebookTweet about this on TwitterShare on Google+Share on LinkedIn

Female Reproductive System Gallery

Download cliparts illustrating anatomy of reproduction organs, oogenesis and sexual cycle, hormonal control, women’s diseases and conditions.

Please note: Free downloads are intended to facilitate healthcare education for people in need in low income countries and can be used for educational purposes only. If you can afford it or if you plan to use the images for commercial purposes, please consider buying instead. You can find a larger image collection at higher resolution for sale at affordable prices on Alila Medical Media website.

To download: right click on full size image – choose “Save image as” and save it into your computer. By downloading from this website you acknowledge that you agree to our Conditions of Use.
To purchase larger sizes of the image: (left) click on full size image.

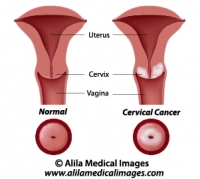
Cervical cancer, labeled diagram.
Diagram showing cancer of the cervix, labeled.
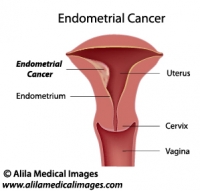
Uterine cancer, labeled diagram.
Illustration of tumor of the endometrium of female uterus, labeled.
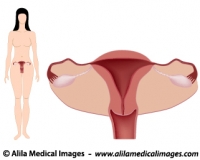
Women's system simple version, unlabeled.
Diagram showing female body with anatomy of reproductive system, anterior view, simple unlabeled version.
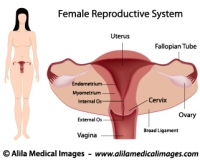
Women's system simple version, labeled.
Diagram showing female body with anatomy of reproductive system, anterior view, simple labeled version.
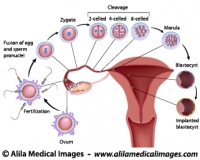
From fertilization to implantation, labeled diagram.
Diagram showing early human embryo development events, from fertilization to implantation of blastocyst, labeled.
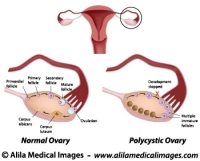
Polycystic and normal ovary, labeled diagram.
Normal ovarian cycle and Polycystic ovary syndrome illustration, labeled.
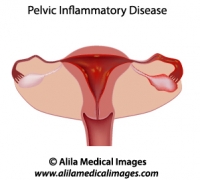
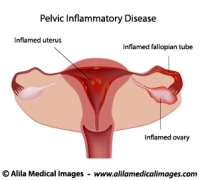
Pelvic inflammatory disease (PID)
Pelvic inflammatory disease (PID) diagram, unlabeled
Pelvic inflammatory disease (PID) diagram
Pelvic inflammatory disease (PID) diagram, labeled
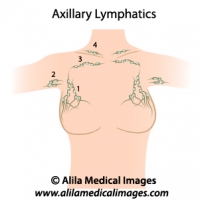
Axillary lymph nodes, medical drawing.
Axillary lymph nodes diagram, simple version. 1-3 = different groups of axillary nodes, 4= supraclavicular lymph nodes. Unlabeled diagram.
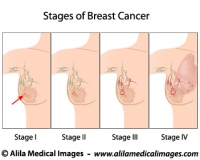
Breast cancer staging, diagram.
Stages of Breast Cancer, from small tumor to metastasis, medical illustration, unlabeled.
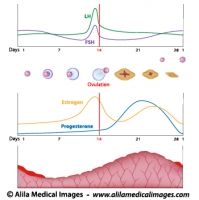
Menstrual cycle and ovulation, labeled diagram.
Normal menstrual cycle and the hormonal control of ovulation, labeled illustration.
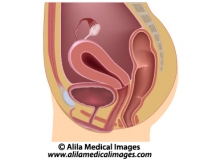
Women's reproductive system, unlabeled diargam.
Diagram showing organs of female reproductive tract in median section.
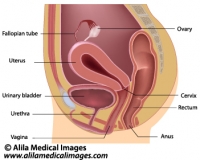
Women's reproductive system, labeled diargam.
Diagram showing organs of female reproductive tract in median section.
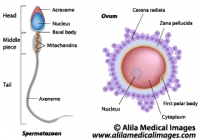
Ovum and spermatozoon structure, labeled diagram.
Egg and sperm cells anatomy, labeled drawing.


Email this to someoneShare on FacebookTweet about this on TwitterShare on Google+Share on LinkedIn

Oral Cavity Gallery

Download illustrations of permanent and deciduous dentition, tooth anatomy, periodontal diseases, teeth replacement therapy, mouth anatomy and diseases.

Please note: Free downloads are intended to facilitate healthcare education for people in need in low income countries and can be used for educational purposes only. If you can afford it or if you plan to use the images for commercial purposes, please consider buying instead. You can find a larger image collection at higher resolution for sale at affordable prices on Alila Medical Media website.

To download: right click on full size image – choose “Save image as” and save it into your computer. By downloading from this website you acknowledge that you agree to our Conditions of Use.
To purchase larger sizes of the image: (left) click on full size image.

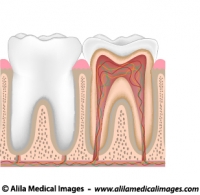
Tooth anatomy, unlabeled diagram.
Tooth anatomy from outside and in cross section, unlabeled drawing.
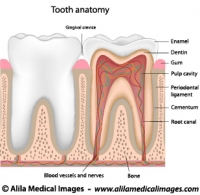
Tooth anatomy, labeled diagram.
Tooth anatomy from outside and in cross section, labeled drawing.
Dental checkup icon
Dental checkup icon
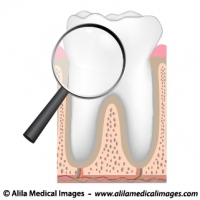
Magnifying glass on a molar tooth, illustration.
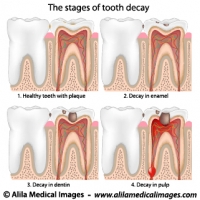
Plaque and tooth decay, medical drawing.
Tooth decay stages diagram.
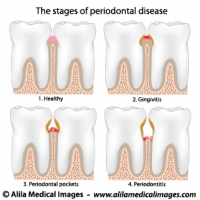
Periodontal Disease, labeled diagram.
Gum disease stages, from gingivitis to periodontitis.
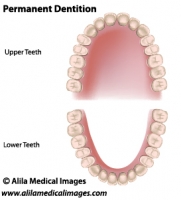
Adult dentition, medical drawing.
Permanent teeth, adult dentition, upper and lower jaws, unlabeled.
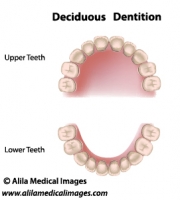
Deciduous dentition, medical drawing.
Deciduous dentition (baby or milk teeth), upper and lower jaws, medical illustration unlabeled..
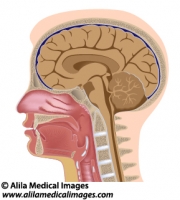
Head anatomy median section, medical drawing.
Median section of human head diagram with details of brain, sinuses, tonsils, oral and nasal cavity, pharynx and larynx, unlabeled.
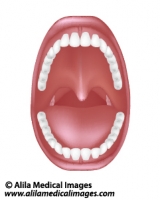
Mouth and throat anatomy, medical drawing.
Diagram of human oral cavity with denture, tonsils, unlabeled.


Email this to someoneShare on FacebookTweet about this on TwitterShare on Google+Share on LinkedIn

Urinary System Gallery

Download anatomical illustrations of kidneys, urine formation process, urinary tract diseases and conditions.

Please note: Free downloads are intended to facilitate healthcare education for people in need in low income countries and can be used for educational purposes only. If you can afford it or if you plan to use the images for commercial purposes, please consider buying instead. You can find a larger image collection at higher resolution for sale at affordable prices on Alila Medical Media website.

To download: right click on full size image – choose “Save image as” and save it into your computer. By downloading from this website you acknowledge that you agree to our Conditions of Use.

To purchase larger sizes of the image: (left) click on full size image.

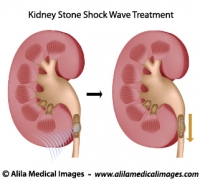
Treatment of kidney stones, medical drawing.
Ultrasound shock wave therapy for kidney stones, unlabeled.
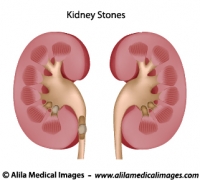
Kidney stones, medical drawing.
Diagram of healthy kidney anatomy and kidney with stones blocking urine passage, unlabeled.
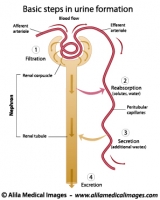
Formation of urine, labeled diagram.
Basic steps in urine formation in a nephron of kidney.
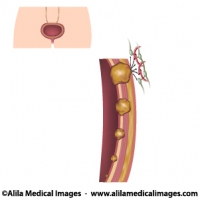
Urinary bladder cancer stages, medical drawing.
Staging of urinary bladder cancer diagram, unlabeled
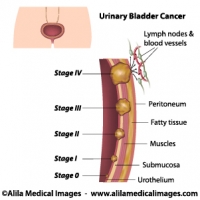
Urinary bladder cancer stages, labeled.
Staging of urinary bladder cancer diagram, labeled
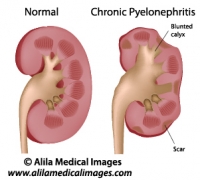
Chronic pyelonephritis, labeled diagram.
Chronic pyelonephritis kidney disease with tissue scarring and blunted calyx, medical illustration.
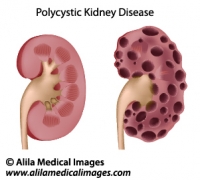
Polycystic kidney disease, medical drawing.
Diagram of enlarged kidney with multiple cysts compared to normal anatomy, unlabeled.
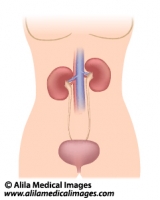
Urinary organs in female, medical illustration.
Female urinary system diagram showing kidneys, ureters and bladder, simple version unlabeled.
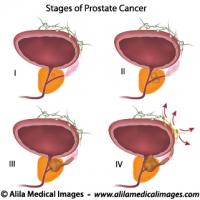
Prostate cancer staging, unlabeled diagram.
Illustration of staging of prostate gland cancer, from small tumor size to metastasis.
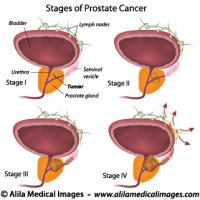
Prostate cancer staging, labeled diagram.
Illustration of staging of prostate gland cancer, from small tumor size to metastasis.


Email this to someoneShare on FacebookTweet about this on TwitterShare on Google+Share on LinkedIn

Eyes, Vision Gallery

Download diagrams of human eye anatomy, tear film and lacrimal gland, muscles of the orbit and associated nerves, defects and diseases, laser surgery treatment.

Please note: Free downloads are intended to facilitate healthcare education for people in need in low income countries and can be used for educational purposes only. If you can afford it or if you plan to use the images for commercial purposes, please consider buying instead. You can find a larger image collection at higher resolution for sale at affordable prices on Alila Medical Media website.

To download: right click on full size image – choose “Save image as” and save it into your computer. By downloading from this website you acknowledge that you agree to our Conditions of Use.
To purchase larger sizes of the image: (left) click on full size image.

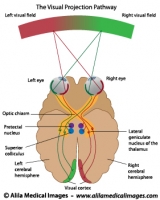
Visual pathways , labeled diagram.
Diagram of visual projection pathway from eyes to brain (visual cortex), labeled.
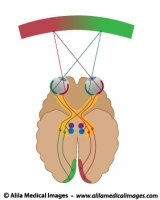
Visual pathways , unlabeled diagram.
Diagram of visual projection pathway from eyes to brain (visual cortex), unlabeled.
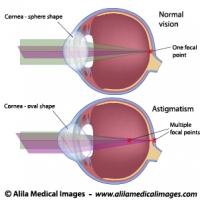
Astigmatism, labeled diagram.
The oval shape of the cornea of the eye in people with astigmatism creates multiple focal points.
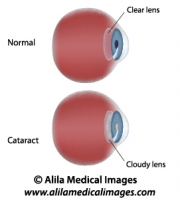
Cataract, labeled diagram.
Illustration of Eye disease - Cataract, clouding of lens.
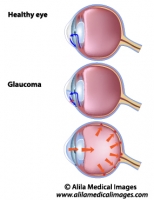
Glaucoma, unlabeled diagram.
Illustration of stages of development of glaucoma, a common eye disease.
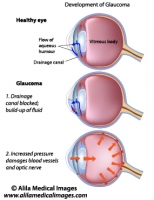
Glaucoma, labeled diagram.
Illustration of stages of development of glaucoma, a common eye disease.
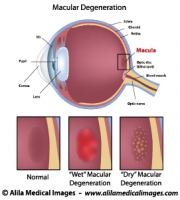
Macular degeneration, labeled diagram.
Diagram showing eye common disease: macular degeneration (dry and wet), labeled.
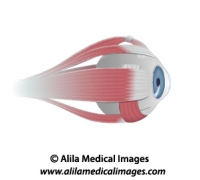
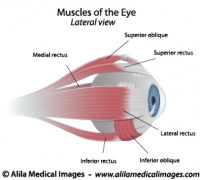
Muscles of the eye, unlabeled diagram.
Diagram showing extrinsic muscles controlling movement of the eye, unlabeled.
Muscles of the eye, labeled diagram.
Diagram showing extrinsic muscles controlling movement of the eye, labeled.
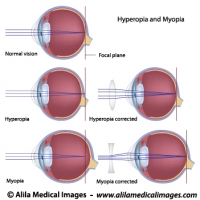
Common eye defects diagrams
Myopia, hyperopia and correction with lenses, labeled illustrations.
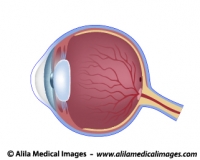
Eye anatomy unlabeled diagram.
Cross section of human eye illustration, unlabeled.
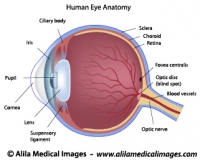
Eye anatomy labeled diagram.
Cross section of human eye illustration, labeled.
Eye adaptation to near vision, illustration.
The near response of the eye , lens accommodation, labeled diagram.
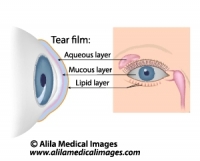
Dry eye syndrome, labeled diagram
Tears composition and the glands involved in tears production, labeled.


Email this to someoneShare on FacebookTweet about this on TwitterShare on Google+Share on LinkedIn