Tag Archives: cardiology

ECG/EKG Reading Made Easy with Animation

The videos on this page are available for licensing here!

Lead 2 is most popular among the 12 leads. This is because the net movement of the heart’s impulses is toward lead II, making it the best general view. Unless otherwise specified, we will be looking at lead 2.

Our analysis will include the following: heart rate, heart rhythm, P wave, PR interval, QRS complex, ST segment.

For heart rate: Identify the QRS complex – usually the biggest on an ECG; count the number of small squares between two consecutive QRS complexes and calculate the heart rate with this formula. If this number is variable, count the number of QRS complexes on a 6 second strip and multiply by 10. A normal heart rate is between 60 and 100 beats per minute. A rate of less than 60 bpm is bradycardia; heart rate of more than 100 bpm is tachycardia.

For rhythm: measure the intervals between the R waves. If these intervals vary by less than 1.5 small squares, the rhythm is regular; if the variation is greater than 1.5 small squares, the rhythm is irregular.

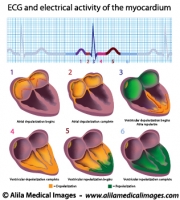
P wave represents depolarization of the atria initiated by the SA node. Presence of a normal P wave therefore indicates sinus rhythm. P waves are most prominent in leads II, III, aVF and V1.

Absence of P waves indicates non-sinus rhythms. Absence of P waves and presence of irregular narrow QRS complexes are the hallmark of atrial fibrillation. The baseline may be undulating or totally flat.

A sawtooth pattern instead of regular P waves signifies atrial flutter. These are called flutter waves. The number of flutter waves preceding a QRS complex corresponds to number of atrial contractions to one ventricular contraction.

P wave is the summation of 2 smaller waves resulting from depolarization of the right atrium followed by that of the left atrium. Normal P waves are rounded, smooth and upright in most leads. In V1, P wave is biphasic, with an initial positive deflection corresponding to activation of the right atrium, and a subsequent negative deflection, resulting from activation of the left atrium.

Unusual morphology of P waves is indicative of atrial enlargement. In right atrial enlargement, depolarization of the right atrium lasts longer than normal and its waveform extends to the end of that of the left atrium. This results in a P wave that is taller than normal, more than 2.5 small squares. Its duration remains unchanged, less than 120ms. In V1, this is seen as a taller initial positive deflection of the P wave, more than 1.5 small squares. Right atrial enlargement is usually due to pulmonary hypertension.

In left atrial enlargement, depolarization of the left atrium lasts longer than normal. This results in a wider P wave, of more than 3 small squares. The waveform may also be notched. In V1 the negative portion of P wave is deeper and wider. Left atrial enlargement is commonly due to mitral stenosis.

P-wave inversion in the inferior leads indicates a non-sinus rhythm. When this happens measure the PR interval. If the PR interval is less than 3 small squares, the rhythm is started in the AV junction – AV nodal junctional rhythm. If the PR interval is more than 3 small squares, the origin of the rhythm is within the atria – ectopic atrial rhythm.


The PR interval is measured from the start of the P wave to the start of the QRS complex and reflects the conduction through the AV node.

A longer than normal PR interval signifies an abnormal delay in the AV node, or an AV block. A consistent long PR interval of more than 5 small squares constitutes first-degree heart block. It might be a sign of hyperkalemia or digoxin toxicity. A progressive prolongation of PR interval followed by a P wave WITHOUT a QRS complex is the hallmark of second-degree AV block type I.

A shorter than normal PR interval, of less than 3 small squares, signifies that the ventricles depolarize too early. There are 2 scenarios for this to happen:

  • Pre-excitation syndrome: presence of an accessory pathway bypassing the AV node.
  • AV nodal (junctional) rhythm: Non-sinus rhythm initiated from around the AV node area instead of the SA node. In this case, P waves are either absent or inverted in the inferior leads.

The QRS complex represents depolarization of the ventricles. A normal QRS complex is narrow, between 70 and 100 ms. A wider QRS complex, resulting from an abnormally slow ventricular depolarization, may be caused by:

–          A ventricular rhythm: rhythms originated from ectopic sites in the ventricles. OR

–          An impaired conduction within the ventricles in conditions such as bundle branch block, hyperkalemia or sodium-channel blockade.

A QRS complex wider than three small squares despite sinus rhythm is the hallmark of bundle branch block. When bundle branch block is suspected, check leads V1 and V6 for characteristic patterns of the QRS complex.
The ST segment extends from the end of the S wave to the start of the T wave. A normal ST segment is mostly flat and level with the baseline. Elevation of more than two small squares in the chest leads or one small square in the limb leads, indicates the possibility of myocardial infarction.

Pericarditis causes a characteristic “saddleback” ST segment elevation and PR segment depression in all leads except aVR and V1, where the reverse – ST depression and PR elevation – are seen.

Email this to someoneShare on FacebookTweet about this on TwitterShare on Google+Share on LinkedIn

Coronary Angioplasty


Coronary angioplasty is a non-surgical procedure used to widen coronary arteries with cholesterol plaques. It can also be performed as an emergency treatment for heart attack (myocardial infarction). 

The first part of the procedure is to localize the site of blockage (Fig. 1). This part is called cardiac catheterization and can be performed without subsequent angioplasty, i.e. just for diagnostic purposes.

Below is a narrated animation about myocardial infarction, cardiac catheterization and coronary angioplasty. Click here to license this video and/or other cardiovascular related videos on Alila Medical Media website.

A catheter (guiding catheter) is inserted through the femoral artery at the groin, or less commonly, through the radial artery in the arm (Fig. 1 and 2) and threaded all the way to the aorta. The tip of the catheter is placed at the beginning of the coronary artery to be investigated (it does not go inside the artery). A radio-opaque dye is injected through the catheter into the coronary artery. This enables real-time visualization of the artery using X-ray imaging. A narrowed part of an artery would appear as a bottle neck on an x-ray image (Fig.1).

Click here to see an animation of cardiac catheterization on Alila Medical Media website where the video is also available for licensing.

Cardiac catheterization
Fig. 1: Cardiac catheterization procedure for diagnosis of blocked site. Click on image to see a larger version on Alila Medical Media website where the image is also available for licensing.


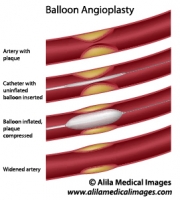
After the location of stenosis (narrowed artery) is identified, angioplasty can begin. A thin guidewire with radio-opaque tip is inserted inside the guiding catheter and threaded past it into the location of plaque. Reminder : the guiding catheter stops at the start of coronary artery, but the guidewire would go further into it and to the location of blockage. An angioplasty catheter (a catheter with deflated balloon) is then inserted in such a way that the guidewire now is inside of it. The balloon is pushed to the location of blockage where it would be inflated and thus crushing the plaque (see Fig. 2 and 3). At the end of procedure, the balloon is again deflated and removed together with all catheters and guidewire.

Click here to see an animation of balloon angioplasty on Alila Medical Media website where the video is also available for licensing.
Coronary angioplasty
Fig. 2: Coronary angioplasty procedure. Click on image to see a larger version on Alila Medical Media website where the image is also available for licensing.


Balloon angioplasty procedure
Fig. 3: Balloon angioplasty procedure. The guidewire is the thin line that goes past the plaque. The guiding catheter is (of course) NOT on this picture as it stays outside of the coronary artery. Click on image to see a larger version on Alila Medical Media website where the image is also available for licensing.


In some cases, a stent is inserted together with the balloon (Fig. 4), inflated and left on place of the plaque to keep the artery open permanently. The stent can be bare-metal (the original version) or drug-eluting (newer versions). Bare-metal stents simply provide a mechanical support.  Drug-eluting stents are coated with various drugs that are released over time and act to prevent tissue growth at the site and/or modulate inflammatory response. The benefit of using stents is still debatable.
Stent angioplasty procedure
Fig. 4: Stent angioplasty procedure. Click on image to see a larger version on Alila Medical Media website where the image is also available for licensing.


Click here to see an animation of stent angioplasty on Alila Medical Media website where the video is also available for licensing.

                                                                           > See all Circulatory topics

Email this to someoneShare on FacebookTweet about this on TwitterShare on Google+Share on LinkedIn

Heart attack


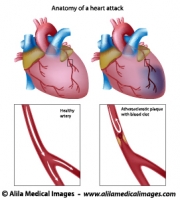
Myocardial infarction, commonly referred to as heart attack, is the sudden death of part of the heart muscle (the myocardium) due to loss of blood flow (ischemia). This occurs when one of  the coronary arteries – the arteries that supply blood to the heart – is blocked.
Coronary arteries, labeled diagram.
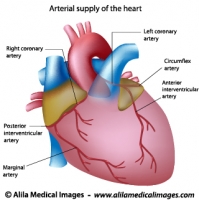
Fig. 1: Coronary arteries supply blood to the heart. They branch out from the first part of the aorta. Click on image to see a larger version on Alila Medical Media website where the image is also available for licensing.


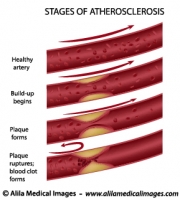
The blockage is commonly due to atherosclerosis – cholesterol plaques/fat deposits on the wall of blood vessels. As the plaque builds up, the vessel becomes narrow restricting blood flow. Under stress, the plaque may rupture. This triggers formation of blood clot on top of the plaque leading to complete blockage of blood flow.  When this happens in a coronary artery, the downstream patch of the myocardium dies from lack of oxygen (Fig. 2). Weaken heart muscle may disrupt electrical activity of the heart and cause fibrillation with subsequent cardiac arrest.
heart attack
Fig. 2: Anatomy of a heart attack due to atherosclerotic plaque. Click on image to see a larger version on Alila Medical Media website where the image is also available for licensing.


Click here to see an animation of heart attack  on Alila Medical Media website where the video is also available for licensing.

Signs and symptoms

The most common symptom is described as a heavy pressure and squeezing pain inside the chest which often radiates to the shoulder and left arm. Other symptoms include shortness of breath, sweating, weakness, nausea and vomiting.

In a number of cases, especially in elderly and people with diabetes, no chest pain or other symptoms are reported. These are called silent myocardial infarction. In such a case, myocardial infarction is diagnosed later with electrocardiograms (ECG), blood enzyme tests or an autopsy.

Risk factors and Causes

Heart attack is caused by build-up of atherosclerotic plaques. Risk factors include smoking, alcohol consumption, obesity, sedentary lifestyle, stress. Incidence increases with age, also, men are more at risk than women.
Onset of acute myocardial infarction is commonly associated with physical and/or psychological exertion. When the body is under physical or emotional stress, blood flow is increased. This leads to stretching of the wall of blood vessels and potentially rupture of plaques.
Below is a narrated animation about myocardial infarction, cardiac catheterization and coronary angioplasty. Click here to license this video and/or other cardiovascular related videos on Alila Medical Media website.


Treatments

Immediate treatments for suspected heart attack include blood thinners such as aspirin. Blood thinners are drugs that prevent further blood clotting. If this doesn’t help, another class of drugs called thrombolytic may be used. Thrombolytic drugs act to dissolve blood clots. This process is called thrombolysis.

Severe cases will require interventional therapy such as angioplasty where the blocked blood vessel is forced to open wider with a balloon and possibly a stent.

People with multiple sites of blockage may require heart bypass surgery. In this surgical procedure, a piece of healthy artery or vein taken from elsewhere in the body is used as a graft to “bypass” the blocked part of coronary artery.

                                                                            > See all Circulatory topics

Email this to someoneShare on FacebookTweet about this on TwitterShare on Google+Share on LinkedIn

Heart, Blood and Circulation Gallery

Download illustrations of human circulatory system: gross anatomy, cardiac cycle, heart diseases and congenital defects, cardiovascular conditions and surgery treatment, blood cell formation, vascular disorders, and more.

Please note: Free downloads are intended to facilitate healthcare education for people in need in low income countries and can be used for educational purposes only. If you can afford it or if you plan to use the images for commercial purposes, please consider buying instead. You can find a larger image collection at higher resolutions for sale at affordable prices on Alila Medical Media website.

To download: right click on full size image – choose “Save image as” and save it into your computer. By downloading from this website you acknowledge that you agree to our Conditions of Use.
To purchase larger sizes of the image: (left) click on full size image.

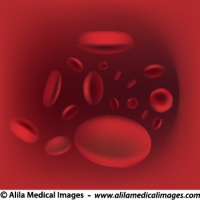
Blood flow in vessel, medical drawing.
Red blood cells streaming in artery
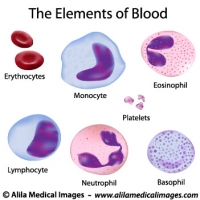
Elements of blood, medical drawing.
Illustration of red and white blood cells, lymphocytes, monocytes, platelets, basophil, eosinophil, neutrophil.
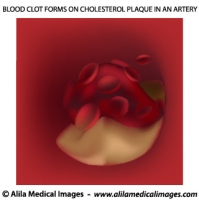
Atherosclerosis, unlabeled.
Blood clot forms on cholesterol plaque in artery blocking blood flow.
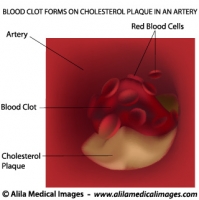
Atherosclerosis, labeled.
Blood clot forms on cholesterol plaque, blocked artery.
Process of cholesterol plaque in artery, unlabeled
Diagram showing process of cholesterol plaque in artery, unlabeled version.
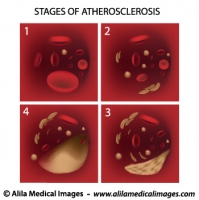
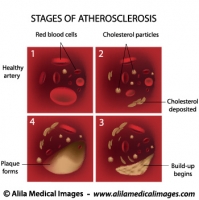
Stages of Atherosclerosis
Process of cholesterol plaque build-up in artery, labeled diagram.
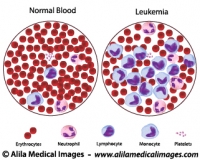
Leukemia versus normal blood count, illustration.
Cancer of blood, Anemia, medical drawing.
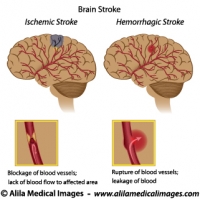
Brain stroke diagrams
Ischemic versus Hemorrhagic brain stroke, unlabeled.
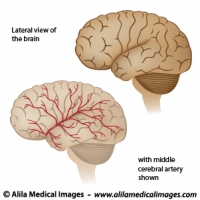
Blood supply to the brain diagram
Lateral view of the brain with middle cerebral artery, unlabeled.
Stages of atherosclerosis diagram
Cholesterol plaque build-up in blood vessel and formation of blood clot cause blockage of blood flow, labeled.
Clipart of healthcare icon (cardiology)
Magnifying glass on an ECG graph diagram
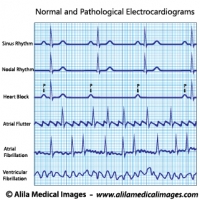
Cardiac arrhythmias ECG/ EKG set diagram.
Normal and pathological electrocardiograms in heart diseases.
EKG and myocardium function diagram
Phases of electrical activity of human heart, ECG cycle.
Myocardial infarction diagram (heart attack)
Coronary artery blocked by cholesterol plaque causing heart stroke.
Human heart blood flow
Illustration of blood flow through the heart, labeled
Human heart blood flow
Illustration of blood flow through the heart, unlabeled
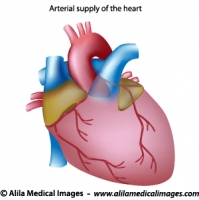
Blood supply to the heart unlabeled diagram
Coronary arteries illustration, anterior view of the heart
Blood supply to the heart labeled diagram
Coronary arteries illustration, anterior view of the heart
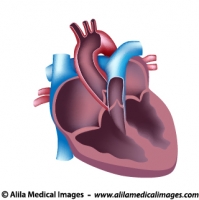
Human heart cut, medical illustration.
Heart anatomy diagram, unlabeled.
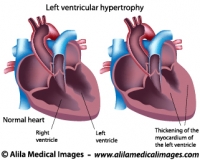
Left ventricular hypertrophy labeled diagram
Thickening of the myocardium of left ventricle of human heart.
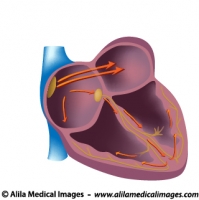
Electrical pathways of the heart, unlabeled
The cardiac conduction system of human heart, unlabeled version.
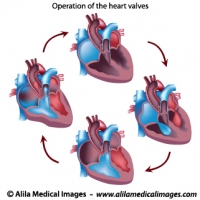
Heart valves operation, unlabeled diagram.
Cycles of heart valves operation pumping blood through different chambers, aorta and veins.
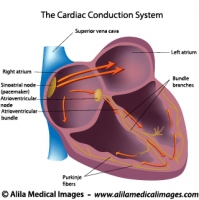
Electrical pathways of the heart
The cardiac conduction system of human heart, labeled version.
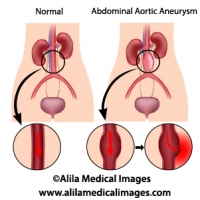
Abdominal aortic aneurysm diagram
Aneurysm in aorta of the abdomen and bleeding risk.
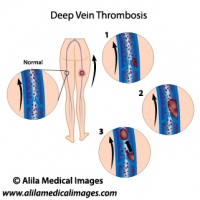
Deep vein thrombosis diagram
Abnormal blood clotting in deep leg vein and formation of thrombus.
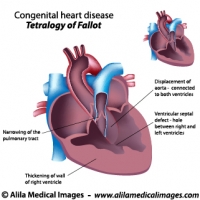
Tetralogy of Fallot diagram
Congenital heart disease: Tetralogy of Fallot, labeled
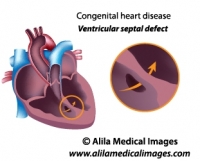
Ventricular septal heart defect diagram.
Congenital heart disease: ventricular septal defect, hole in the septum between ventricles, unlabeled.
Balloon angioplasty procedure diagram
Heart cath procedure with balloon to widen artery with plaque
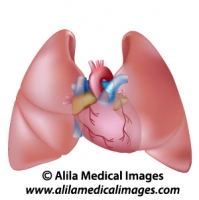
Heart and lungs diagram unlabeled
Human lungs and heart anatomy, unlabeled.
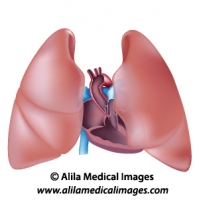
Thorax anatomy unlabeled diagram.
Human heart cross section and lungs anatomy.
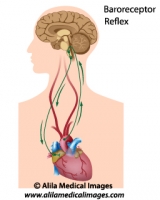
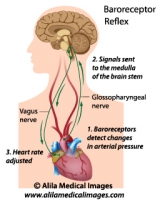
Biofeedback regulation of heart rate, medical illustration.
Regulation of blood pressure through baroreflex, unlabeled version.
Biofeedback regulation of heart rate, labeled.
Regulation of blood pressure through baroreflex, labeled version.
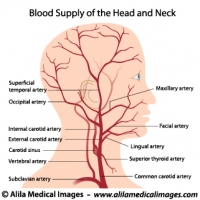
Blood supply to the head and neck, labeled drawing.
Diagram of human head anatomy with arteries including internal carotid supplying the brain, lateral (side) view, labeled.
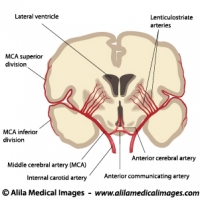
Blood supply to the brain, coronal section.
Middle cerebral artery anatomy and distribution, labeled diagram.
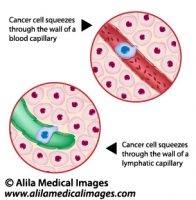
Metastatic cancer, medical drawing.
Cancer cell squeezes through the endothelium of blood and lymph vessel, illustration unlabeled.
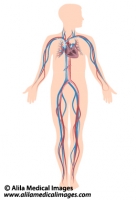
Human circulatory system diagram
Anatomy of human circulation system, unlabeled.
Email this to someoneShare on FacebookTweet about this on TwitterShare on Google+Share on LinkedIn